Ensembles and the thermodynamic limit
![]()
[1]:
from polymers import physics
FJC = physics.single_chain.fjc.thermodynamics.FJC
Isometric versus isotensional
[2]:
import numpy as np
import matplotlib.pyplot as plt
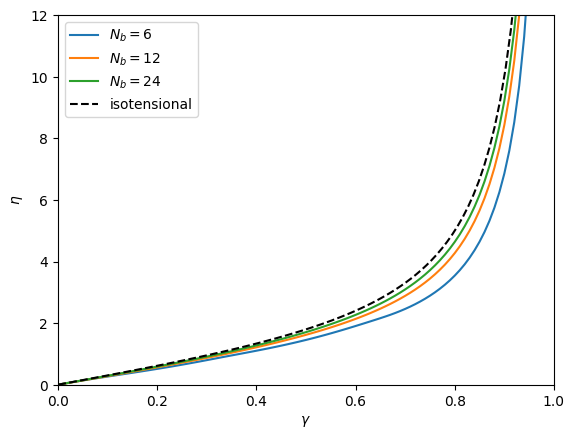
N_b_list = [6, 12, 24]
gamma = np.linspace(1e-3, 99e-2, 100)
for N_b in N_b_list:
fjc = FJC(N_b, 1, 1)
eta_isometric = fjc.isometric.nondimensional_force(gamma)
plt.plot(gamma, eta_isometric, label=r'$N_b=$' + str(N_b))
gamma_isotensional = fjc.isotensional.nondimensional_end_to_end_length_per_link(eta_isometric)
plt.plot(gamma_isotensional, eta_isometric, 'k--', label='isotensional')
plt.legend()
plt.xlim([0, 1])
plt.ylim([0, 12])
plt.xlabel(r'$\gamma$')
plt.ylabel(r'$\eta$')
plt.show()
[3]:
for N_b in N_b_list:
    fjc = FJC(N_b, 1, 1)
    Delta_vartheta = fjc.isometric.nondimensional_relative_helmholtz_free_energy_per_link(gamma)
    plt.plot(gamma, Delta_vartheta, label=r'$N_b=$' + str(N_b))
Delta_vartheta_legendre = fjc.isometric.legendre.nondimensional_relative_helmholtz_free_energy_per_link(gamma)
plt.plot(gamma, Delta_vartheta_legendre, 'k--', label='legendre')
plt.legend()
plt.xlim([0, 1])
plt.ylim([0, 3])
plt.xlabel(r'$\gamma$')
plt.ylabel(r'$\Delta\vartheta$')
plt.show()

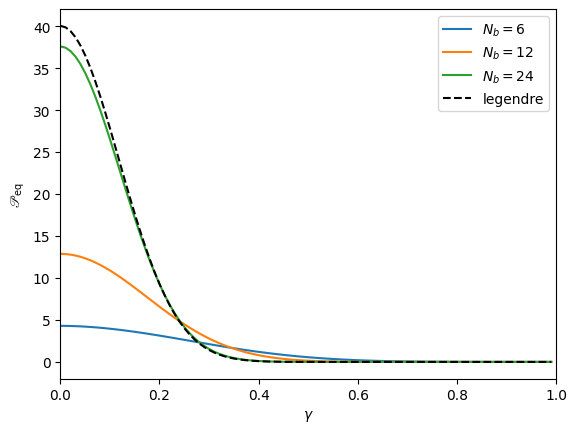
[4]:
for N_b in N_b_list:
    fjc = FJC(N_b, 1, 1)
    P_eq = fjc.isometric.nondimensional_equilibrium_distribution(gamma)
    plt.plot(gamma, P_eq, label=r'$N_b=$' + str(N_b))
P_eq_legendre = fjc.isometric.legendre.nondimensional_equilibrium_distribution(gamma)
plt.plot(gamma, P_eq_legendre, 'k--', label='legendre')
plt.legend()
plt.xlim([0, 1])
plt.xlabel(r'$\gamma$')
plt.ylabel(r'$\mathscr{P}_\mathrm{eq}$')
plt.show()
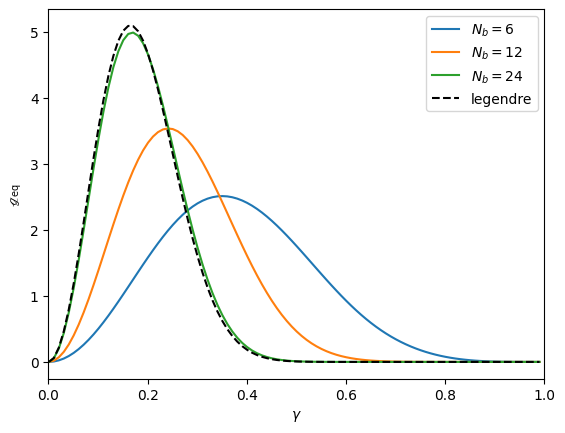
[5]:
for N_b in N_b_list:
    fjc = FJC(N_b, 1, 1)
    g_eq = fjc.isometric.nondimensional_equilibrium_radial_distribution(gamma)
    plt.plot(gamma, g_eq, label=r'$N_b=$' + str(N_b))
g_eq_legendre = fjc.isometric.legendre.nondimensional_equilibrium_radial_distribution(gamma)
plt.plot(gamma, g_eq_legendre, 'k--', label='legendre')
plt.legend()
plt.xlim([0, 1])
plt.xlabel(r'$\gamma$')
plt.ylabel(r'$\mathscr{g}_\mathrm{eq}$')
plt.show()